Diffuser-Augmented Micro-Scale Wind Turbine for Low-Wind-Speed Operation
Design, blade-resolved CFD, and experimental assessment of a micro-scale wind turbine for low-wind-speed operation
This project investigates whether a compact diffuser can improve the low-speed performance of a micro-scale horizontal-axis wind turbine. The work included wind-resource characterization, low-Reynolds-number airfoil screening, blade design, rotor-free duct screening, blade-resolved computational fluid dynamics (CFD), prototype fabrication, and blower-based testing.
This work was completed as my master’s thesis at the School of Interdisciplinary Engineering and Sciences (SINES), National University of Sciences and Technology (NUST), Pakistan, under the supervision of Ammar Mushtaq and Qazi Shahzad Ali.
- Project type: Master’s thesis
- Institution: National University of Sciences and Technology (NUST)
- School: School of Interdisciplinary Engineering and Sciences (SINES)
- Supervisors: Ammar Mushtaq and Qazi Shahzad Ali
- Status: Completed; manuscript in preparation
The numerical and experimental results showed the same performance ordering: the ducted turbine performed better than the bare rotor. The comparison was kept qualitative because CFD predicted aerodynamic rotor power, while the experiments measured rectified DC electrical output after the generator and rectifier.
Project aim
Small wind turbines often operate at low Reynolds numbers and low wind speeds. Under these conditions, viscous effects reduce blade performance, while generator and drivetrain resistance make starting more difficult. A diffuser can create a low-pressure region downstream of the rotor and draw more air through the rotor plane. This can increase the aerodynamic loading and output of a rotor with the same diameter.
The aim of this work was to design and comparatively assess a compact diffuser-augmented wind turbine for weak-wind operation without treating the diffuser as an additional source of energy.
Wind conditions
Wind-speed data were obtained from the publicly available US-Pakistan Center for Advanced Studies in Energy weather-station archive at the National University of Sciences and Technology (NUST), Islamabad. The record covered 6 October 2021 to 23 September 2024 and contained 130,483 unique observations after cleaning.
The mean wind speed was 3.09 m/s, the median was 2.63 m/s, and 82.8% of the observations were below 5 m/s. These conditions provided the application context for the turbine design. A two-parameter Weibull distribution was fitted to the positive wind-speed observations, with a shape parameter of 1.754 and a scale parameter of 3.752 m/s. Zero-valued observations, which represented 7.1% of the cleaned record, were retained in the empirical statistics but excluded from the continuous Weibull fit.
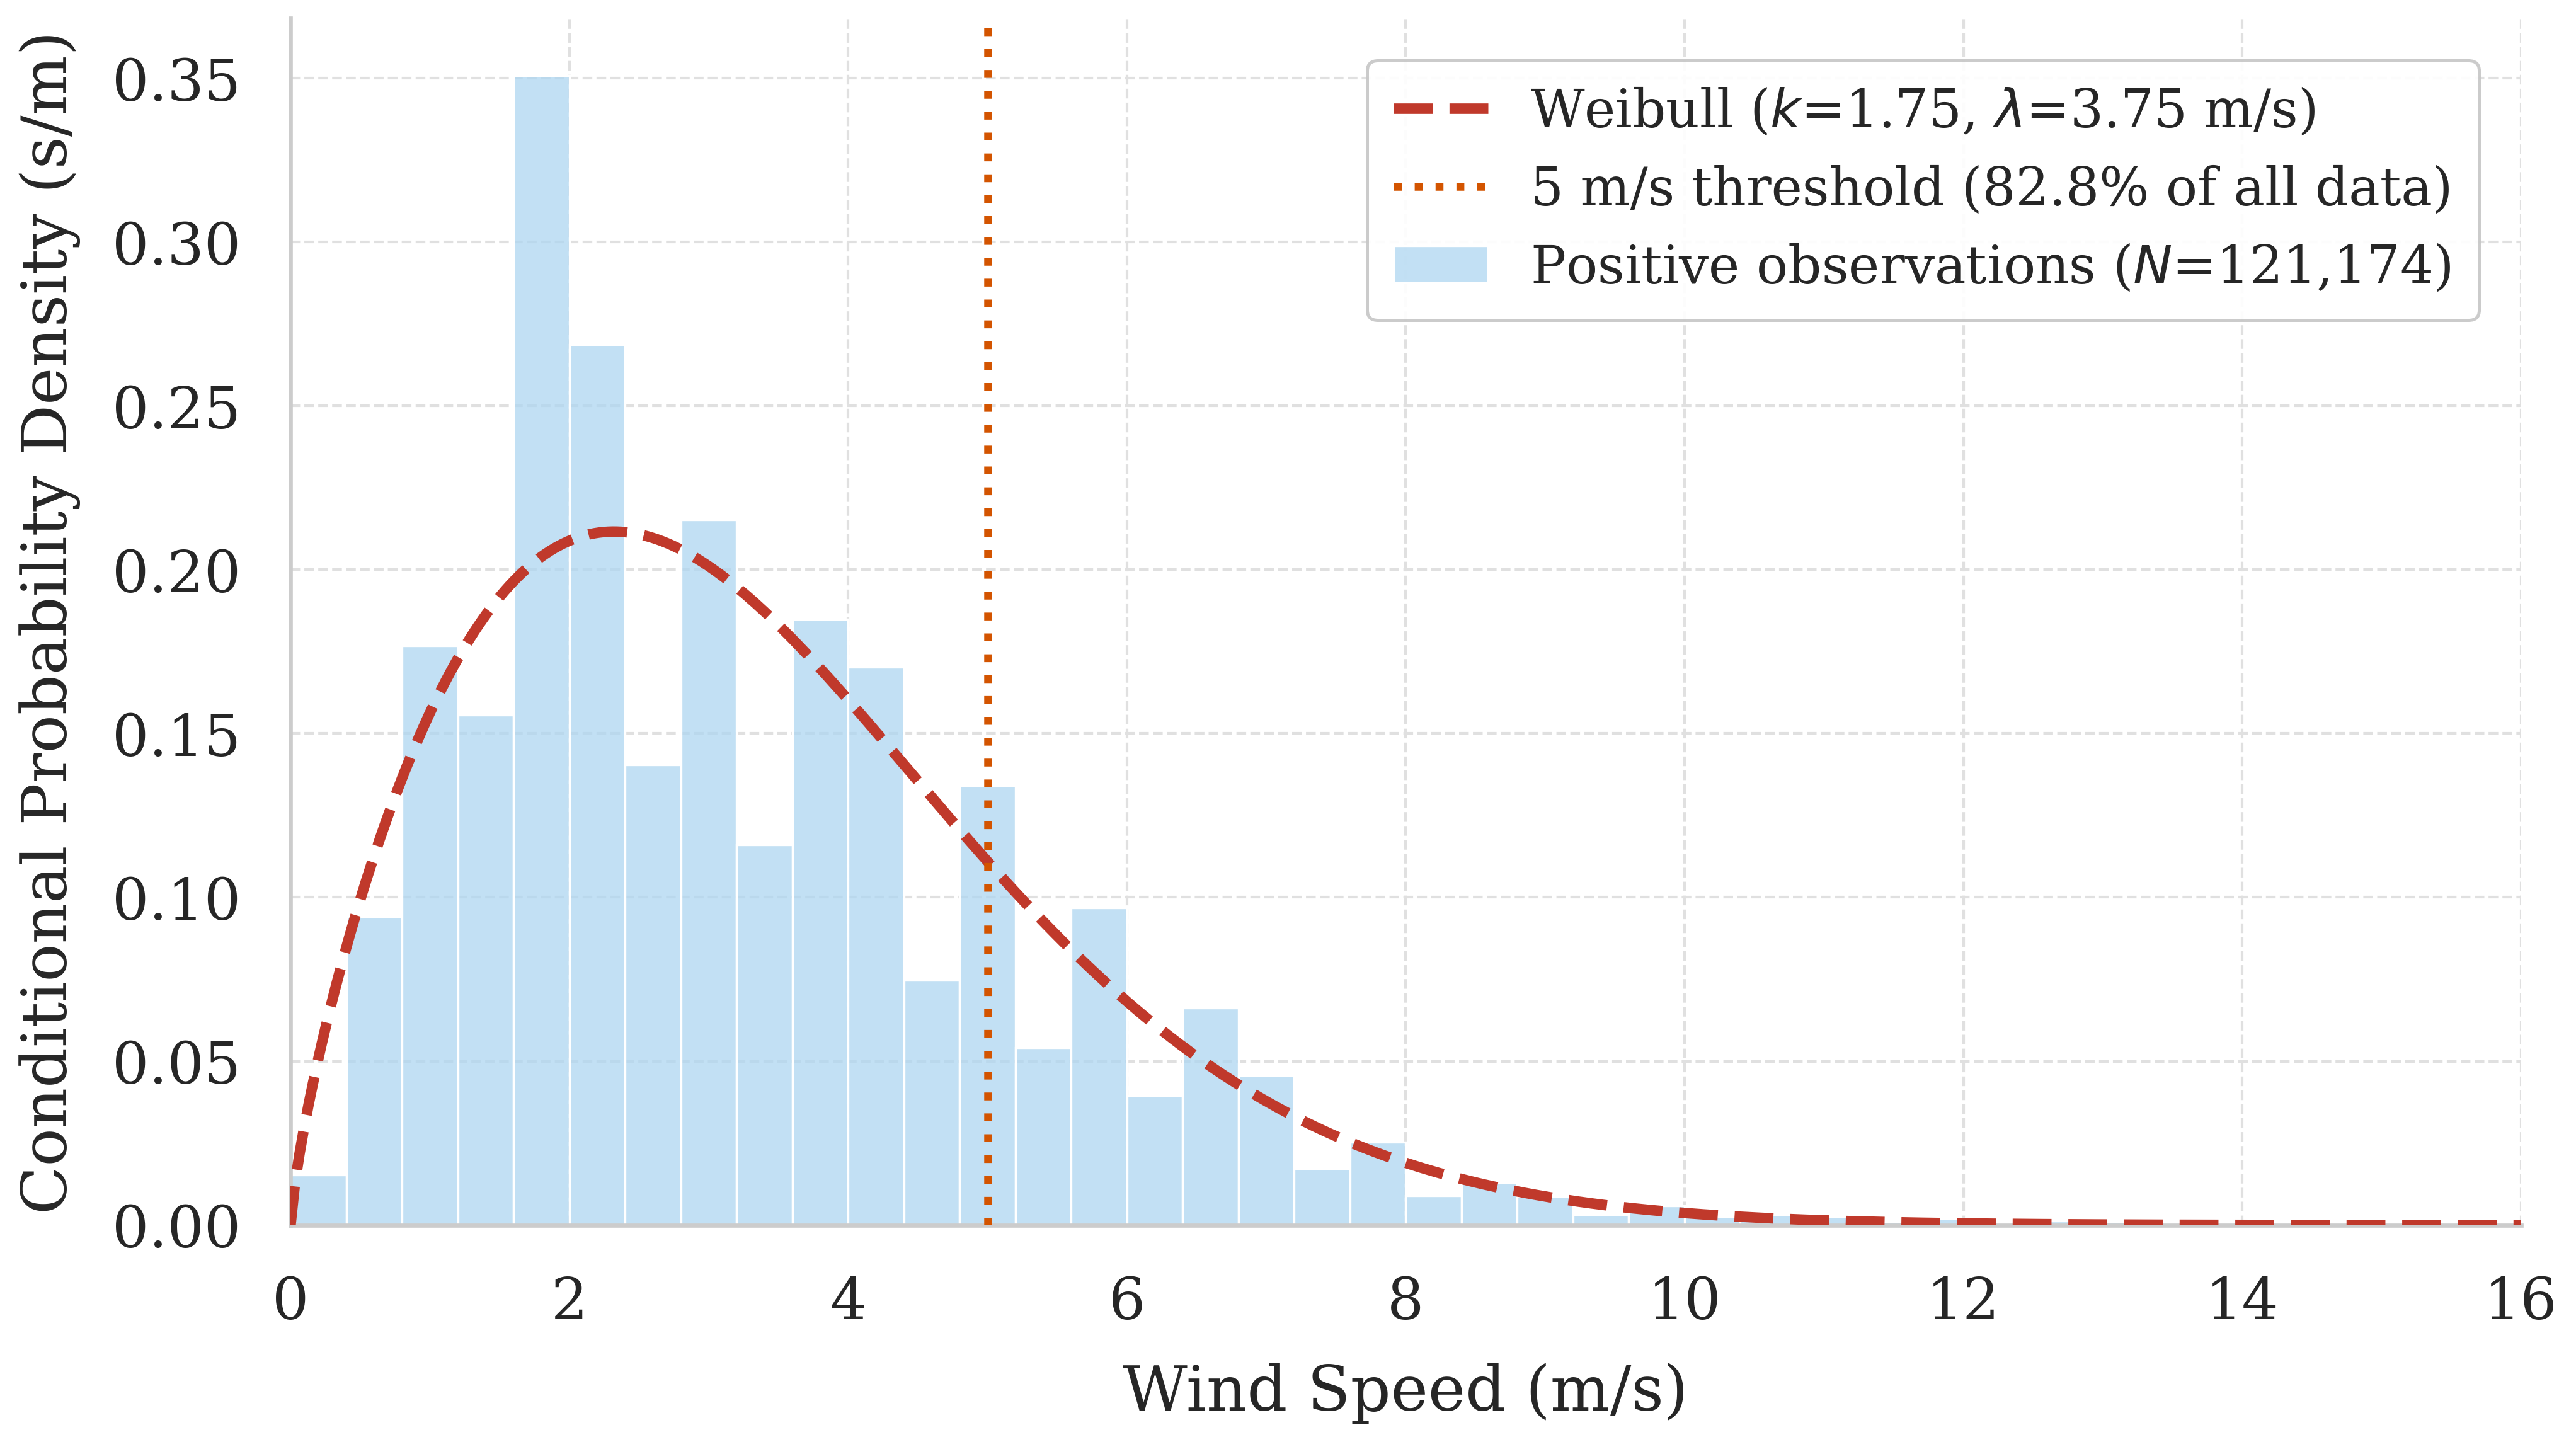
The data describe the measured rooftop environment and were not treated as a complete wind-resource assessment for Islamabad. Building-induced acceleration, turbulence, and directional effects may influence the measurements.
Airfoil and blade design
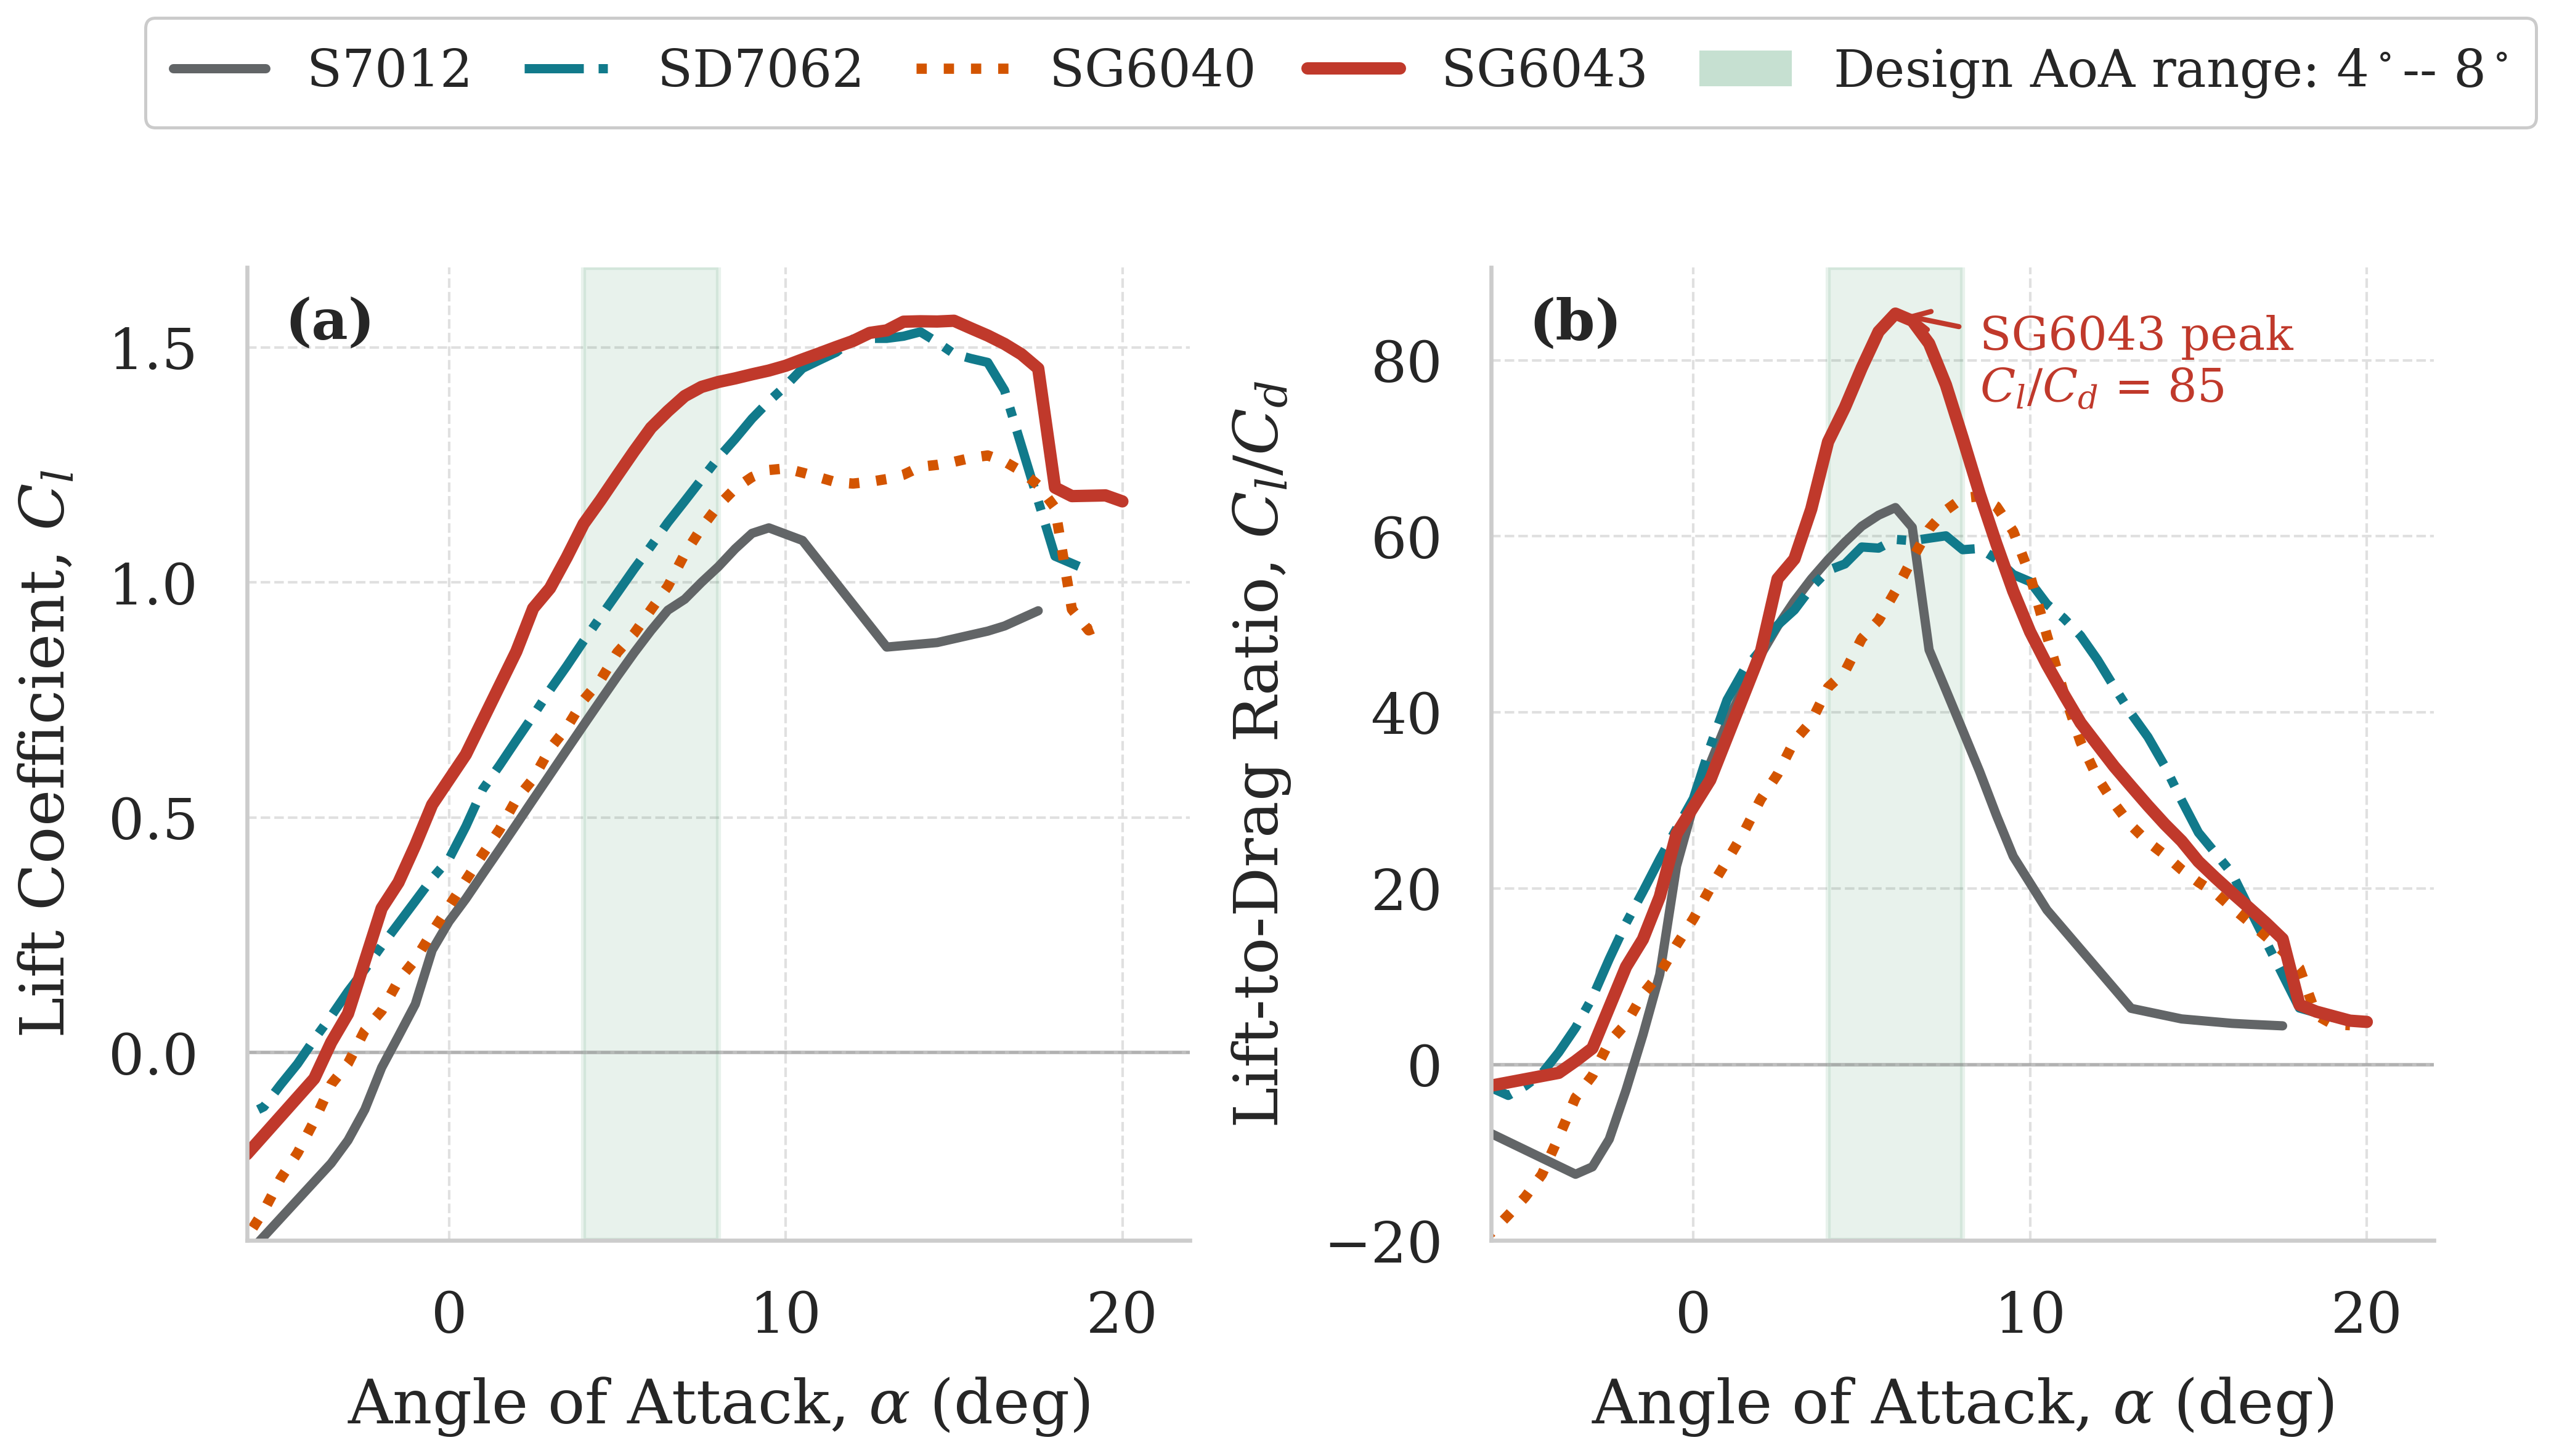
Four airfoils used for small wind turbines were compared: S7012, SD7062, SG6040, and SG6043. Two-dimensional viscous polars were generated with XFOIL through QBlade at a common Reynolds number of (1.5\times10^5). At the design angle of attack of 5 degrees, SG6043 gave the highest calculated lift coefficient and lift-to-drag ratio among the four candidates. It was therefore selected for the rotor.
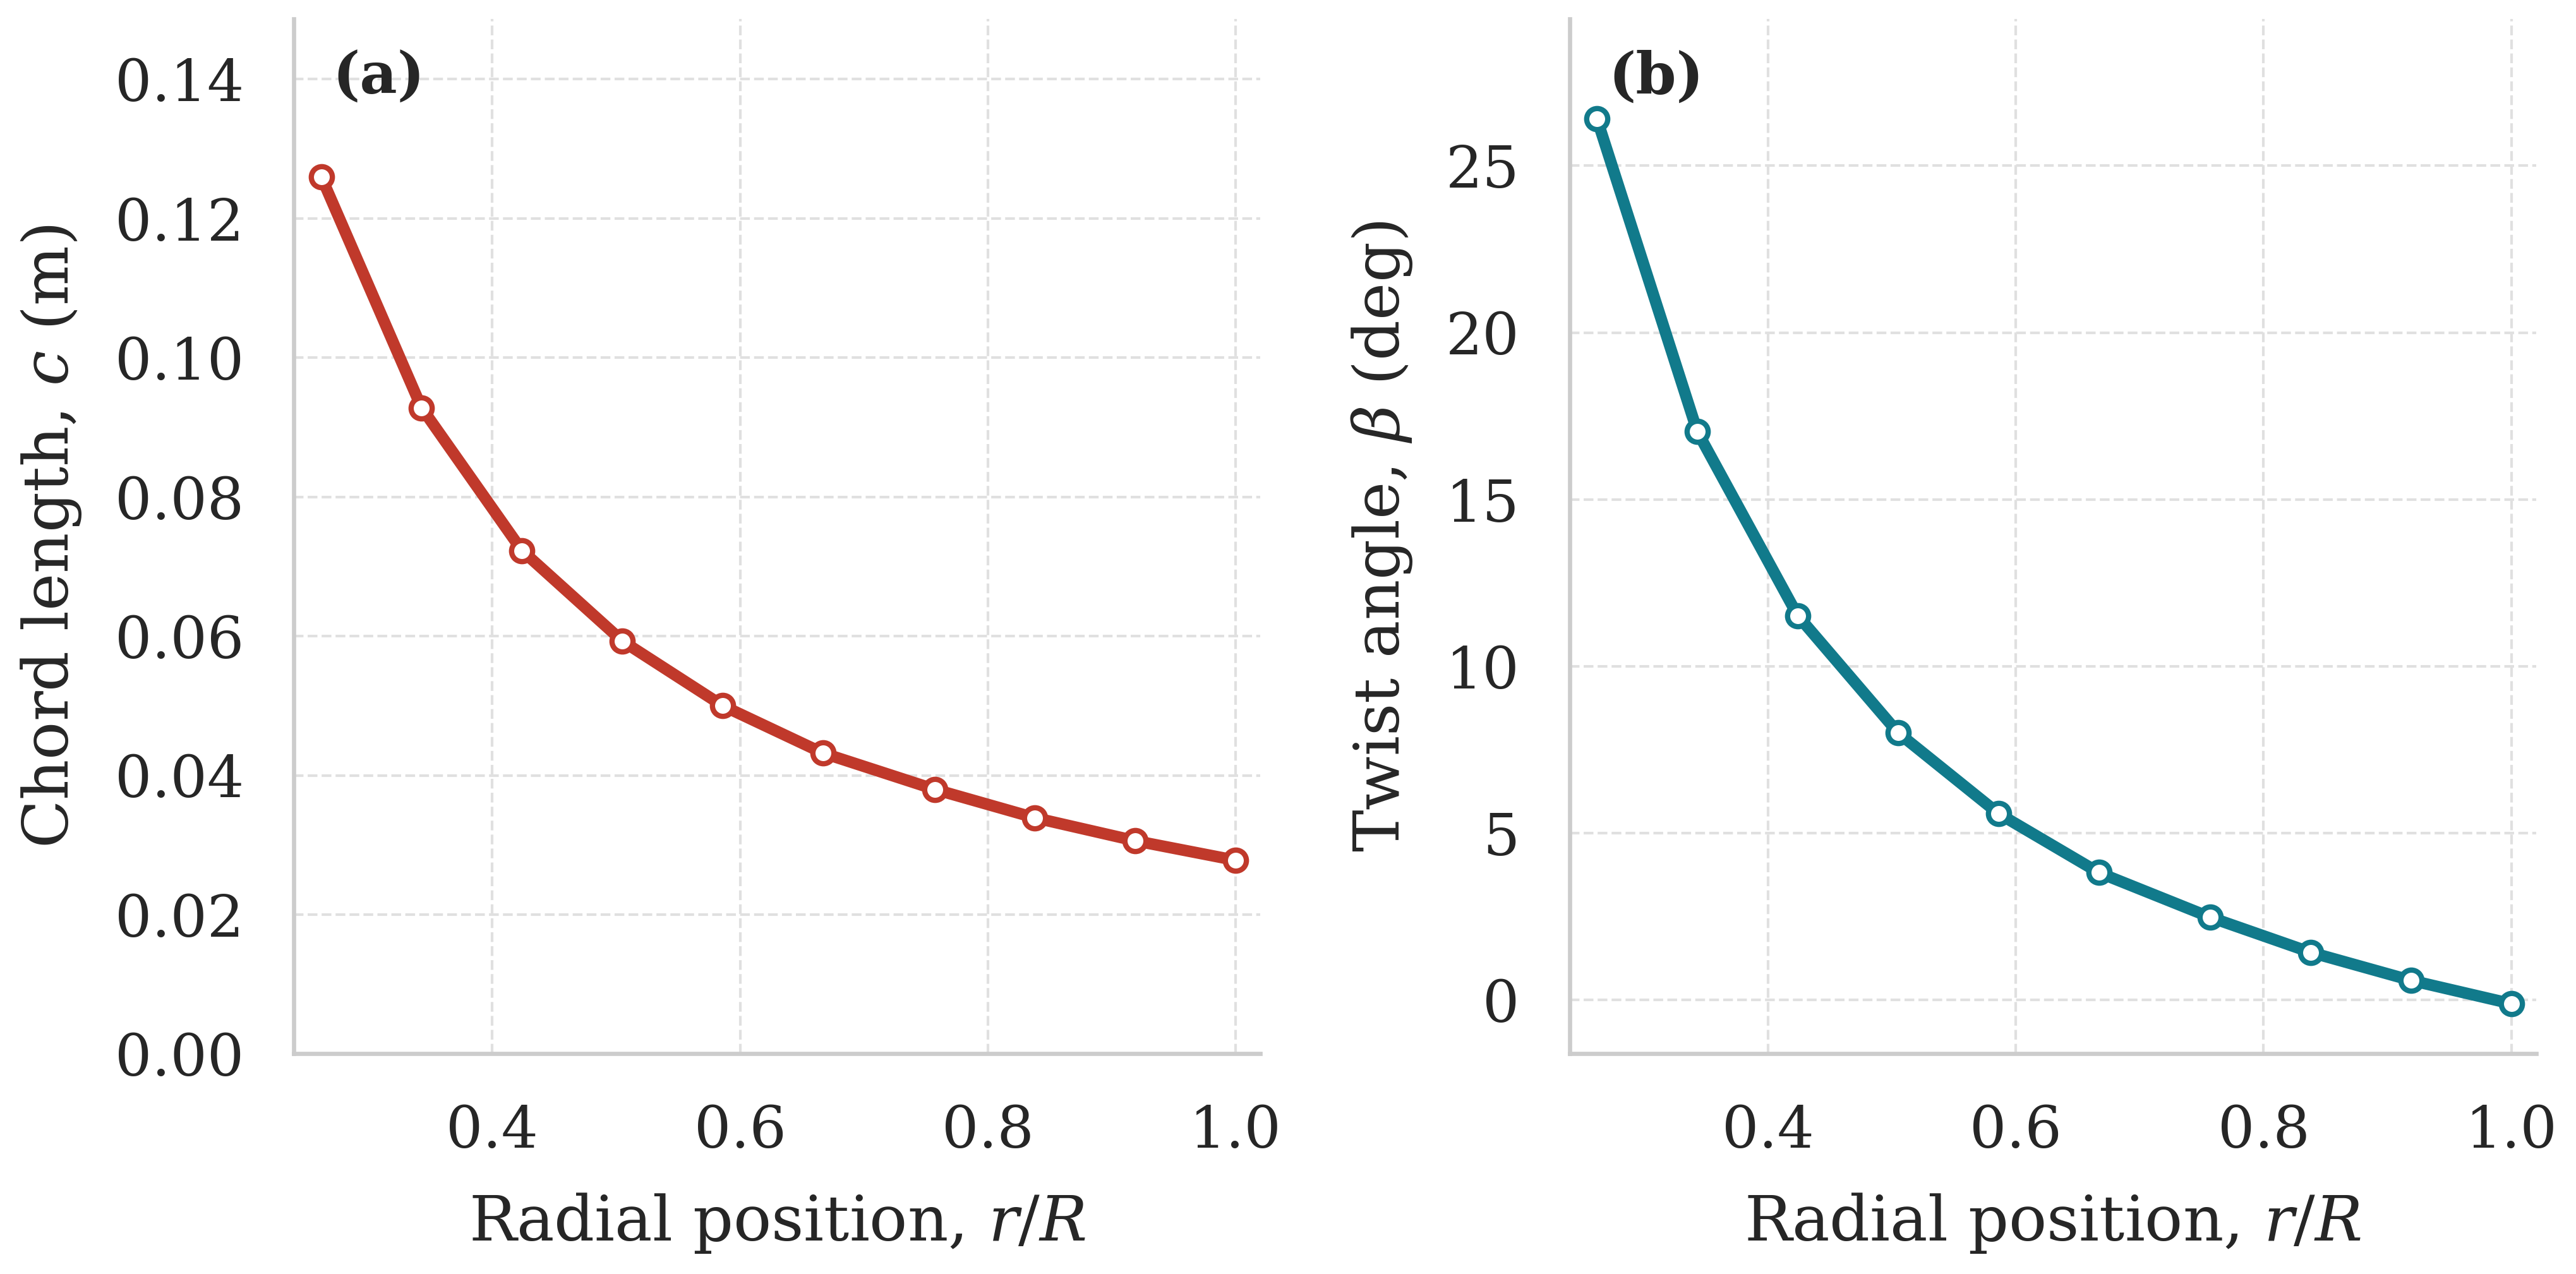
The blade geometry was generated using a custom Python implementation of a blade element momentum theory (BEMT) radial-element procedure. QBlade was used to generate the airfoil polars and to assess the retained rotor; it was not used to generate the chord and twist distributions.
The rotor has three blades, a 0.45 m aerodynamic blade length, a 0.05 m hub radius, and an assembled radius of 0.50 m. Candidate blades were examined at design tip-speed ratios of 4, 5, and 6. The design angle of attack was fixed at 5 degrees, while the local Reynolds number and aerodynamic coefficients were updated at each radial station. The (\lambda=4) blade was retained as a practical compromise between predicted performance, generator-speed compatibility, and manufacturability.
At the reference velocity of 8 m/s, (\lambda=4) corresponds to approximately 611 rpm, within the generator-characterization range of about 200-700 rpm. The 8 m/s value was a controlled blade-design and CFD condition. It was not treated as the most frequent site wind speed or as the turbine cut-in speed.
Duct screening
Six rotor-free duct geometries were compared using the same steady two-dimensional CFD procedure. The candidates included nozzles, diffusers, a cambered airfoil profile, and a flanged diffuser. Duct 6 reproduced the proportions of the rotor-free flanged diffuser studied by Ohya and co-workers. The remaining candidates used different length and area ratios.
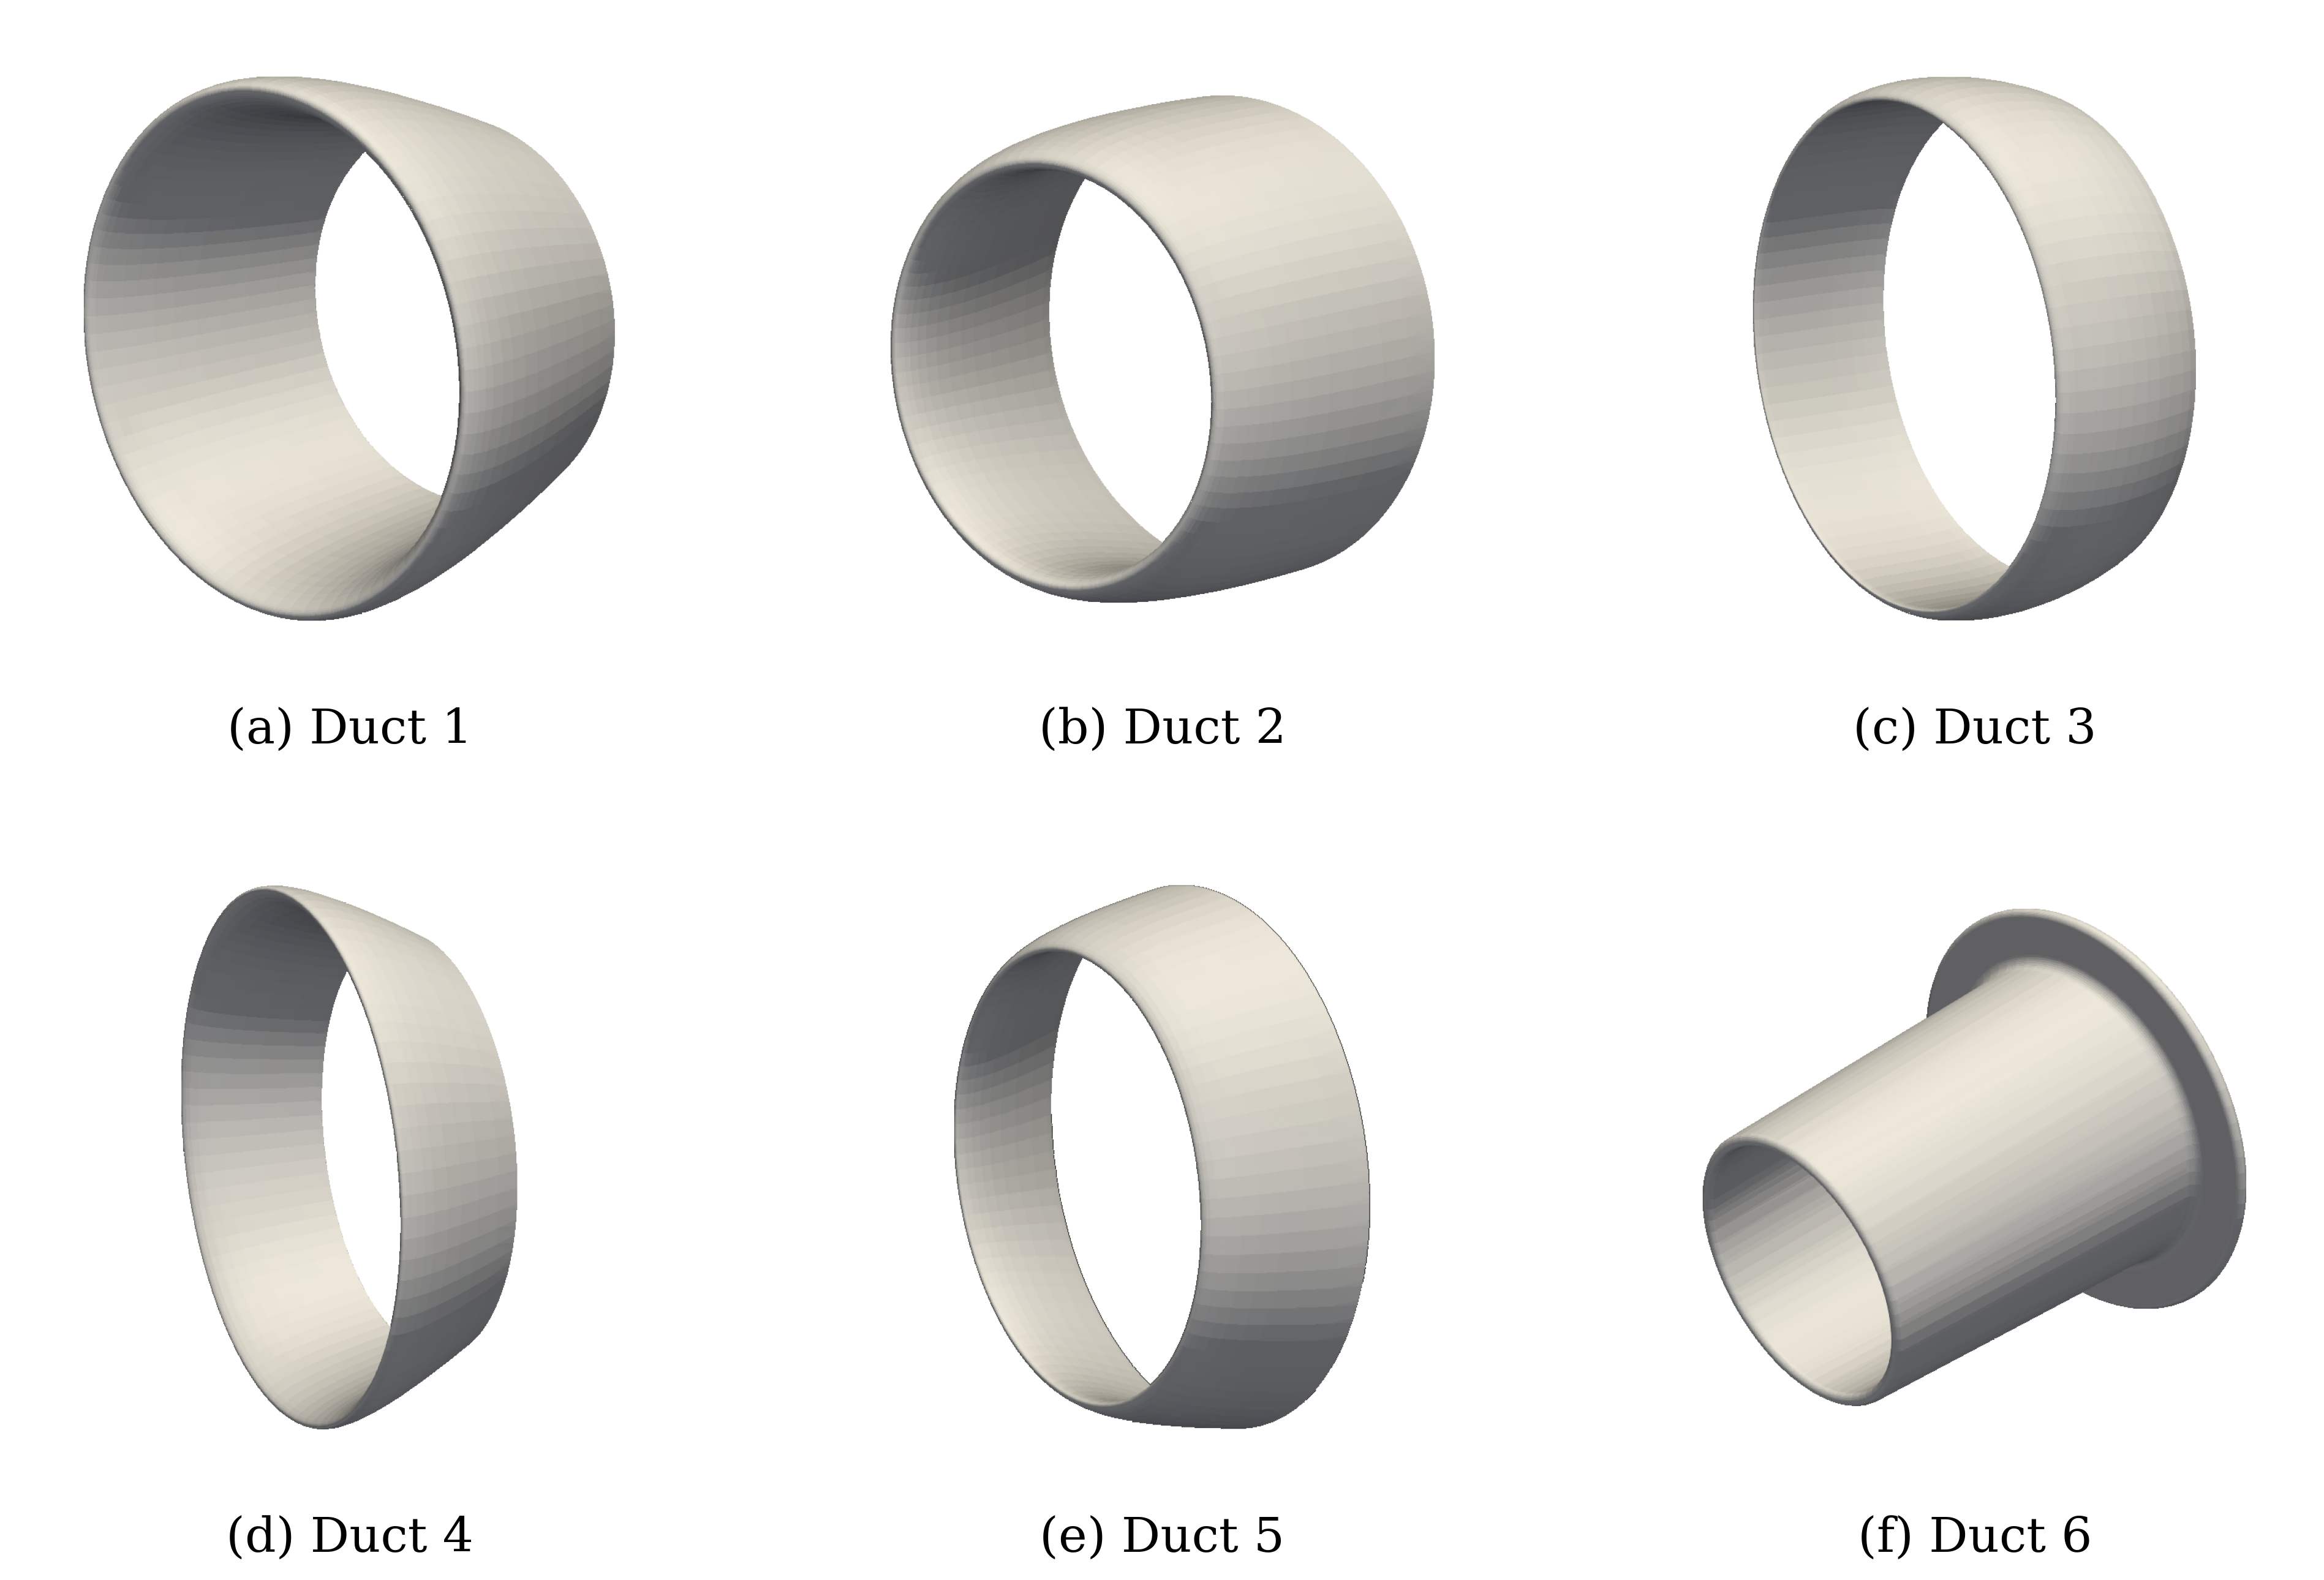
Duct 6 produced the largest and most persistent centerline acceleration, with a peak local velocity ratio of approximately 1.70. It also produced the strongest pressure reduction and the broadest elevated-velocity region across the sampled transverse section. The duct was therefore retained for the blade-resolved rotor-duct simulations.
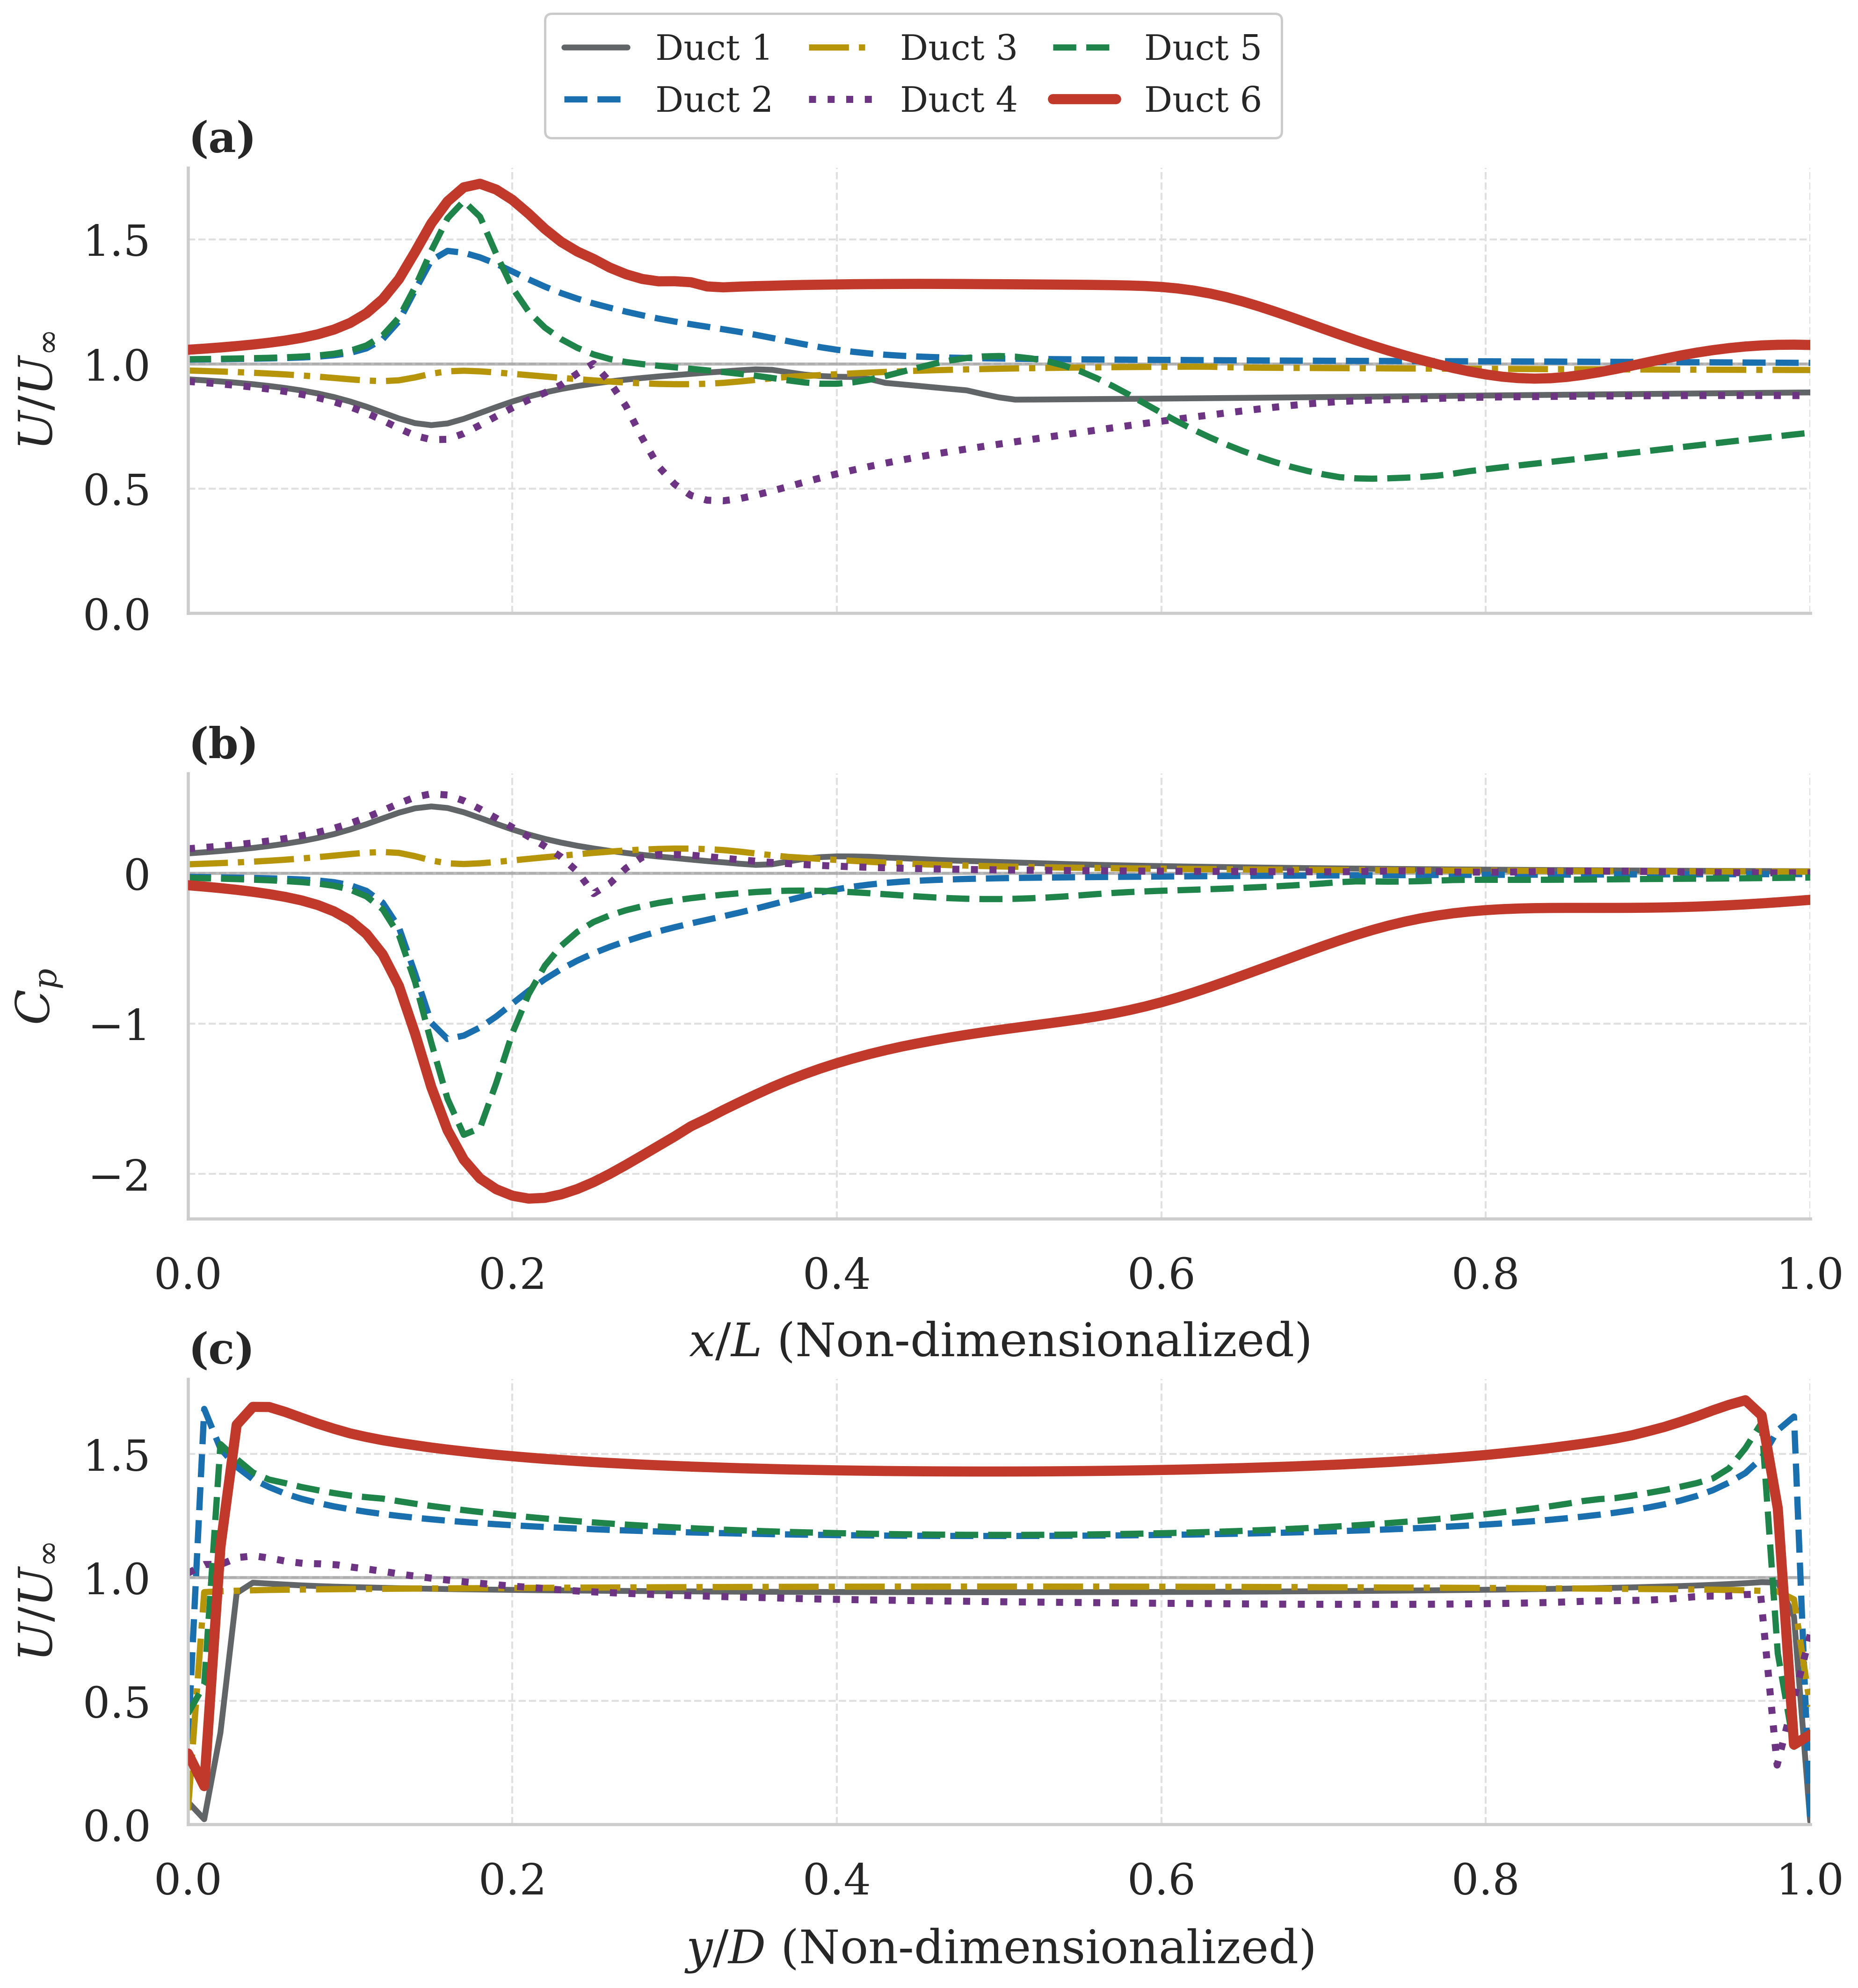
This part of the work was used only for preliminary screening. Because the rotor was not included, the results do not account for rotor pressure loss, blade loading, wake rotation, or power extraction. The local velocity maximum was therefore not treated as proof of turbine power enhancement.
Blade-resolved CFD
The bare rotor and the integrated rotor-duct configuration were simulated in ANSYS Fluent 2022 R1. The simulations used steady incompressible Reynolds-averaged Navier-Stokes equations, the SST (k)-(\omega) turbulence model, and a multiple reference frame treatment of rotation. A 120-degree periodic sector containing one blade was used to represent the three-bladed rotor.
The bare-rotor mesh contained approximately 7.30 million cells. A three-grid study gave rotor torques of 1.46478, 1.55169, and 1.56585 N m for the coarse, selected, and fine grids. The selected-grid result differed from the fine-grid value by 0.91%, and its estimated grid convergence index was 2.07%. A separate grid-convergence study was not available for the integrated rotor-duct model.
The rotor-area-normalized power coefficient was used to compare the aerodynamic performance of the same rotor with and without the duct. A second coefficient, normalized by the maximum projected area of the duct, was also reported to describe the complete device.
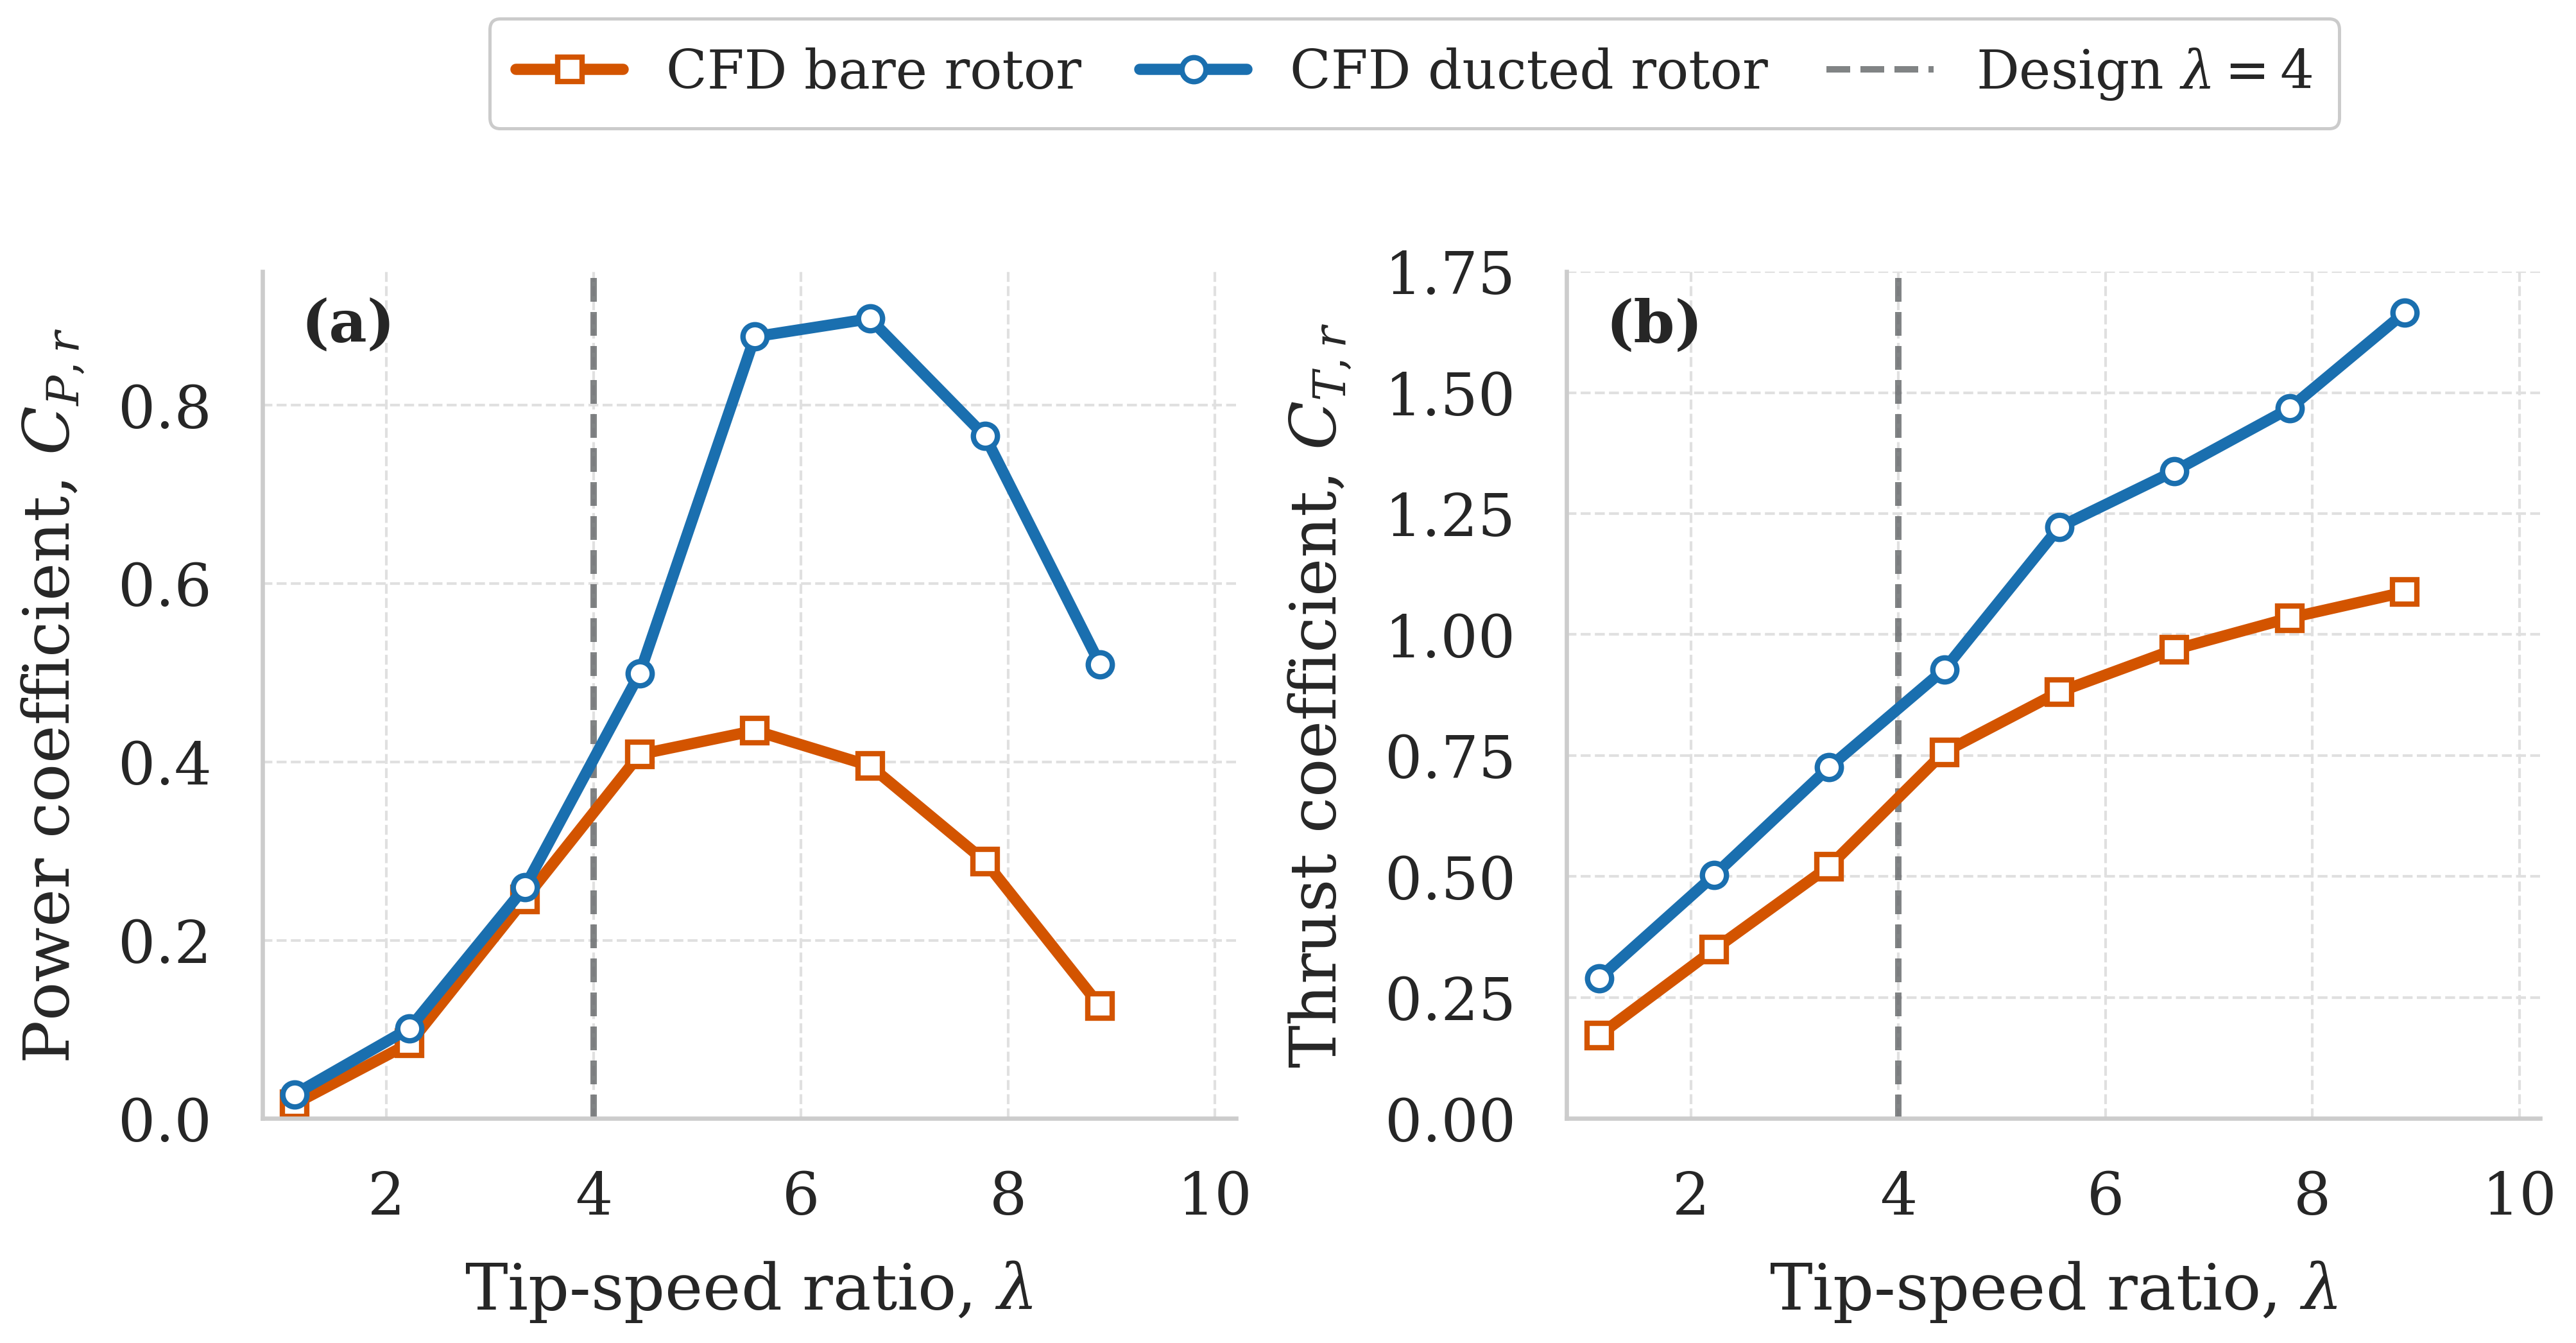
The ducted rotor produced higher power and thrust coefficients at every simulated operating point. At (\lambda=5.56), the bare rotor reached a power coefficient of 0.435, while the ducted rotor reached 0.877, giving a matched-condition ratio of 2.02. The peak rotor-area-normalized power coefficient was approximately 0.43-0.44 for the bare rotor and 0.86-0.89 for the ducted rotor.
The high ducted value represents rotor-level augmentation and not the efficiency of the complete device. When the ducted power was normalized by the maximum projected duct area, the complete-device coefficient was approximately 0.57-0.60.
Prototype testing
The SG6043 blades were manufactured by fused-deposition modelling using carbon-fibre-reinforced PETG. Duct 6 was fabricated from rolled and welded mild-steel sections. The same rotor, generator, support frame, instrumentation, and loading procedure were used for the bare and ducted tests.
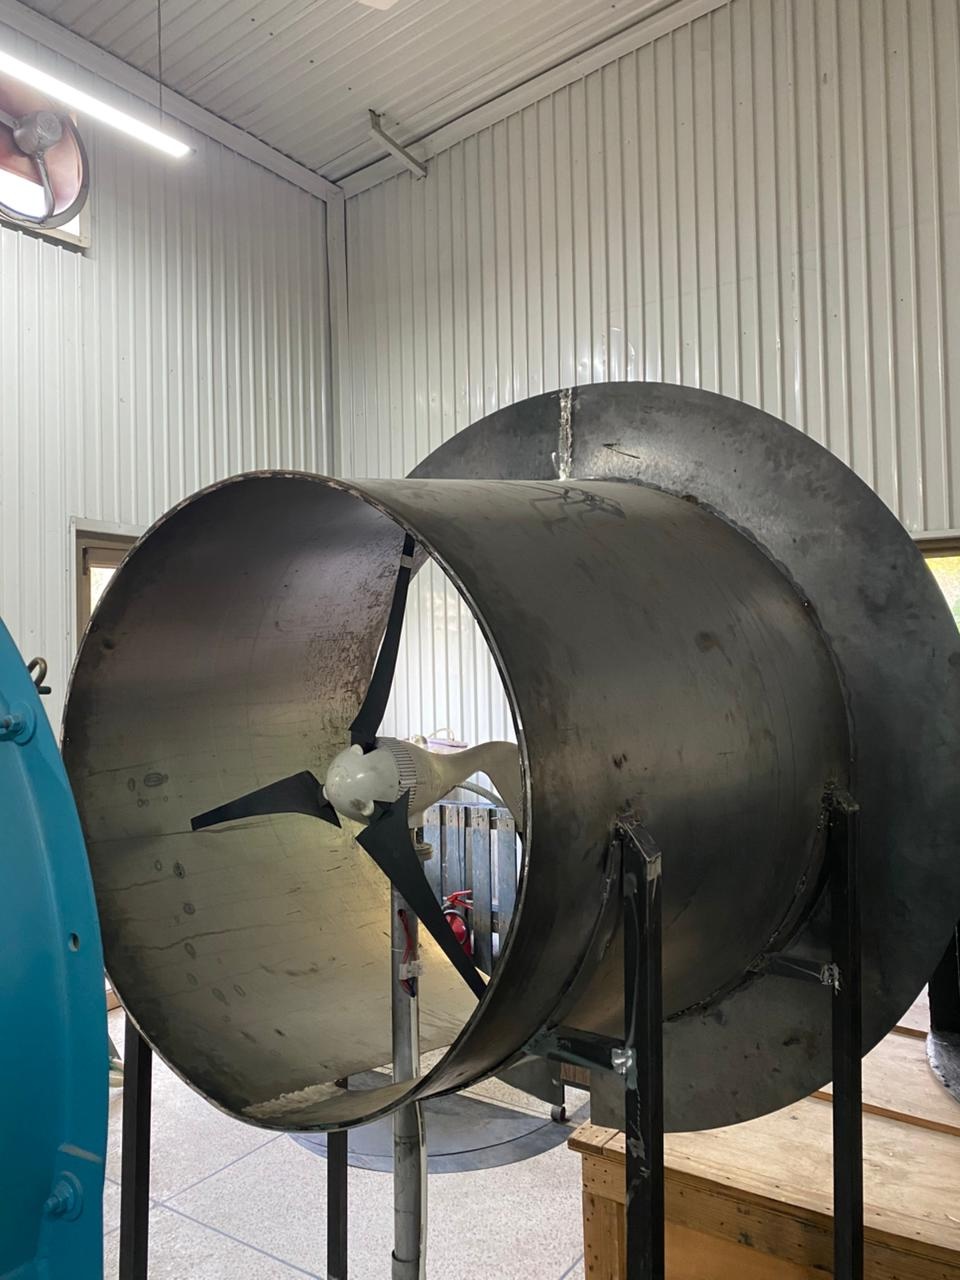
Testing was performed with an indoor blower-based open jet. Wind speed was measured locally near the rotor plane, and the electrical output was recorded using a programmable DC electronic load. At each blower setting, the response was allowed to stabilize before wind speed, rotor speed, voltage, current, and power were recorded. The measurement was repeated to confirm a comparable steady response.
The ducted turbine first produced measurable rectified DC output at 4.40 m/s, compared with 6.38 m/s for the bare rotor. The observed electrical cut-in was therefore reduced by 1.98 m/s, or 31%. These values refer to the discrete blower-test conditions and are not standardized turbine cut-in ratings.
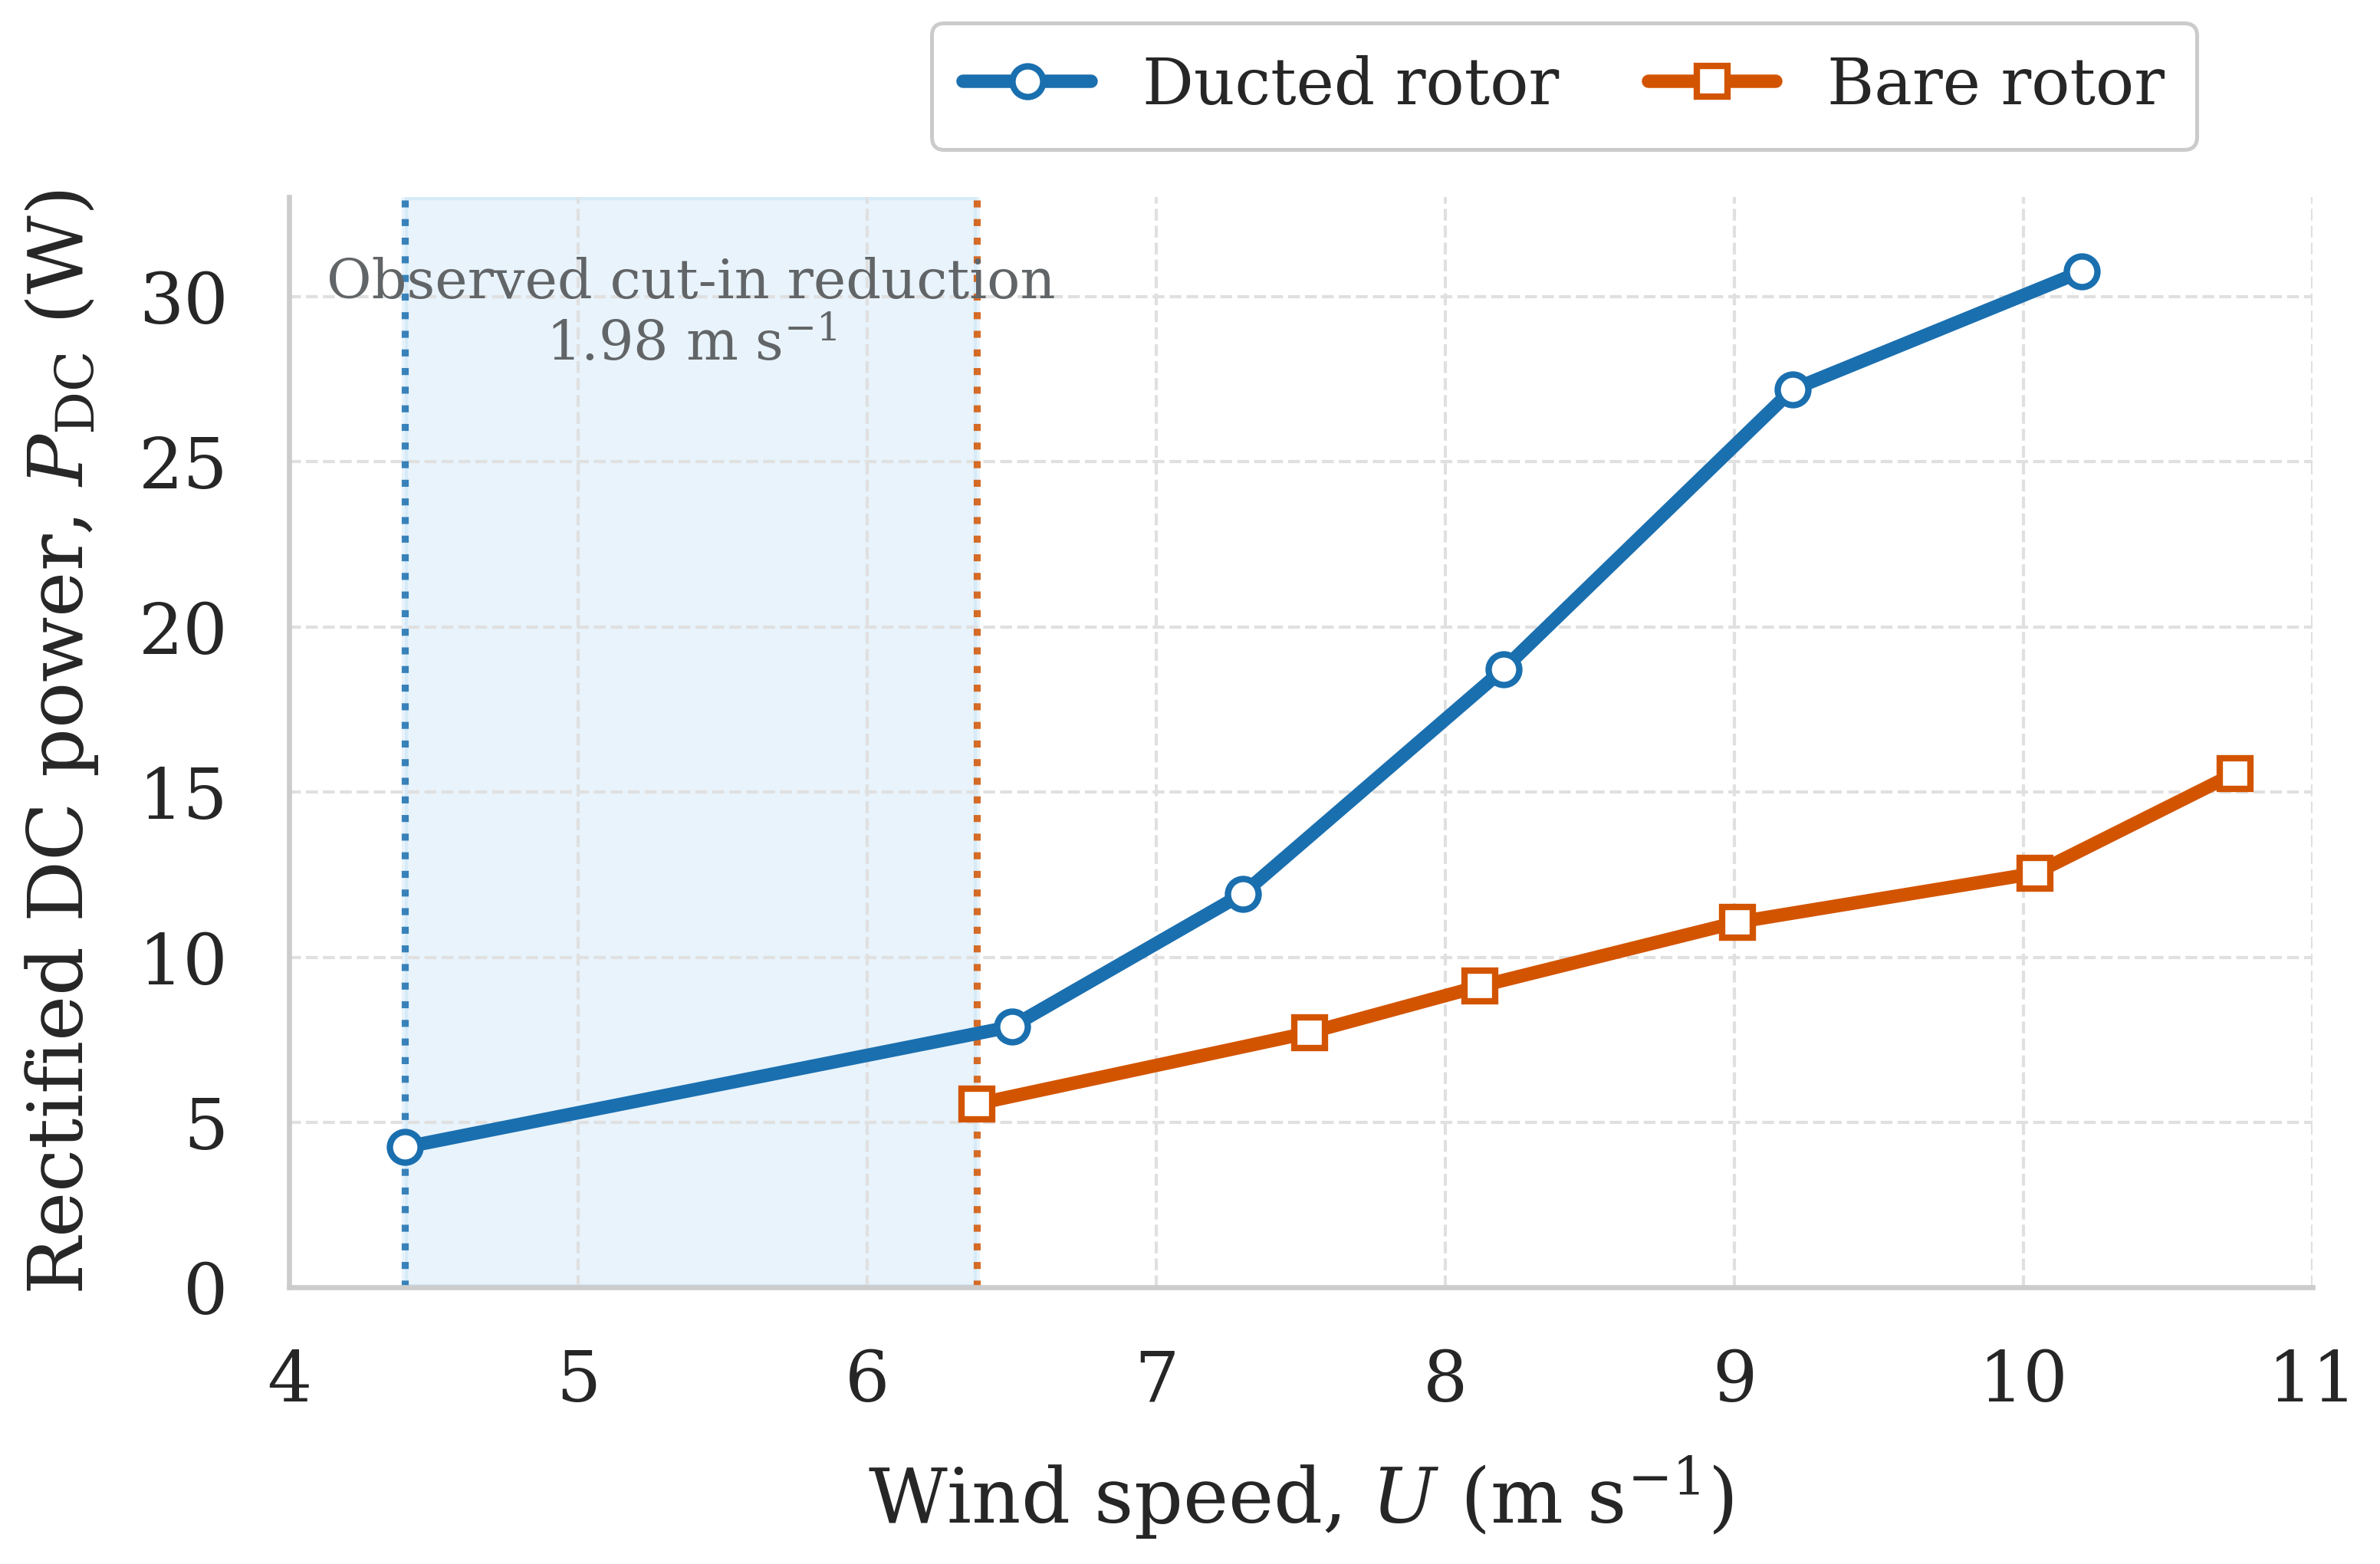
The ducted turbine produced 4.25-30.75 W over measured wind speeds of 4.40-10.20 m/s. The bare turbine produced 5.56-15.56 W over 6.38-10.73 m/s. Over their common measured range, the ducted-to-bare electrical-power ratio was 1.38-2.41, with a median value of 1.98.
The experiments showed a comparative system-level improvement but did not quantitatively validate the CFD power. Shaft torque, generator efficiency, rectifier efficiency, and area-averaged rotor-plane velocity were not measured.
Annual-energy scenario
The measured electrical-power curves were combined with the wind-speed distribution in an exploratory annual-energy calculation. The principal scenario gave 6.03 kWh/year for the bare turbine and 19.83 kWh/year for the ducted turbine, a ratio of 3.29. A conservative case, with power set to zero outside each measured interval, gave 4.93 and 16.60 kWh/year, respectively. Both cases retained an approximate 3.3-fold difference.
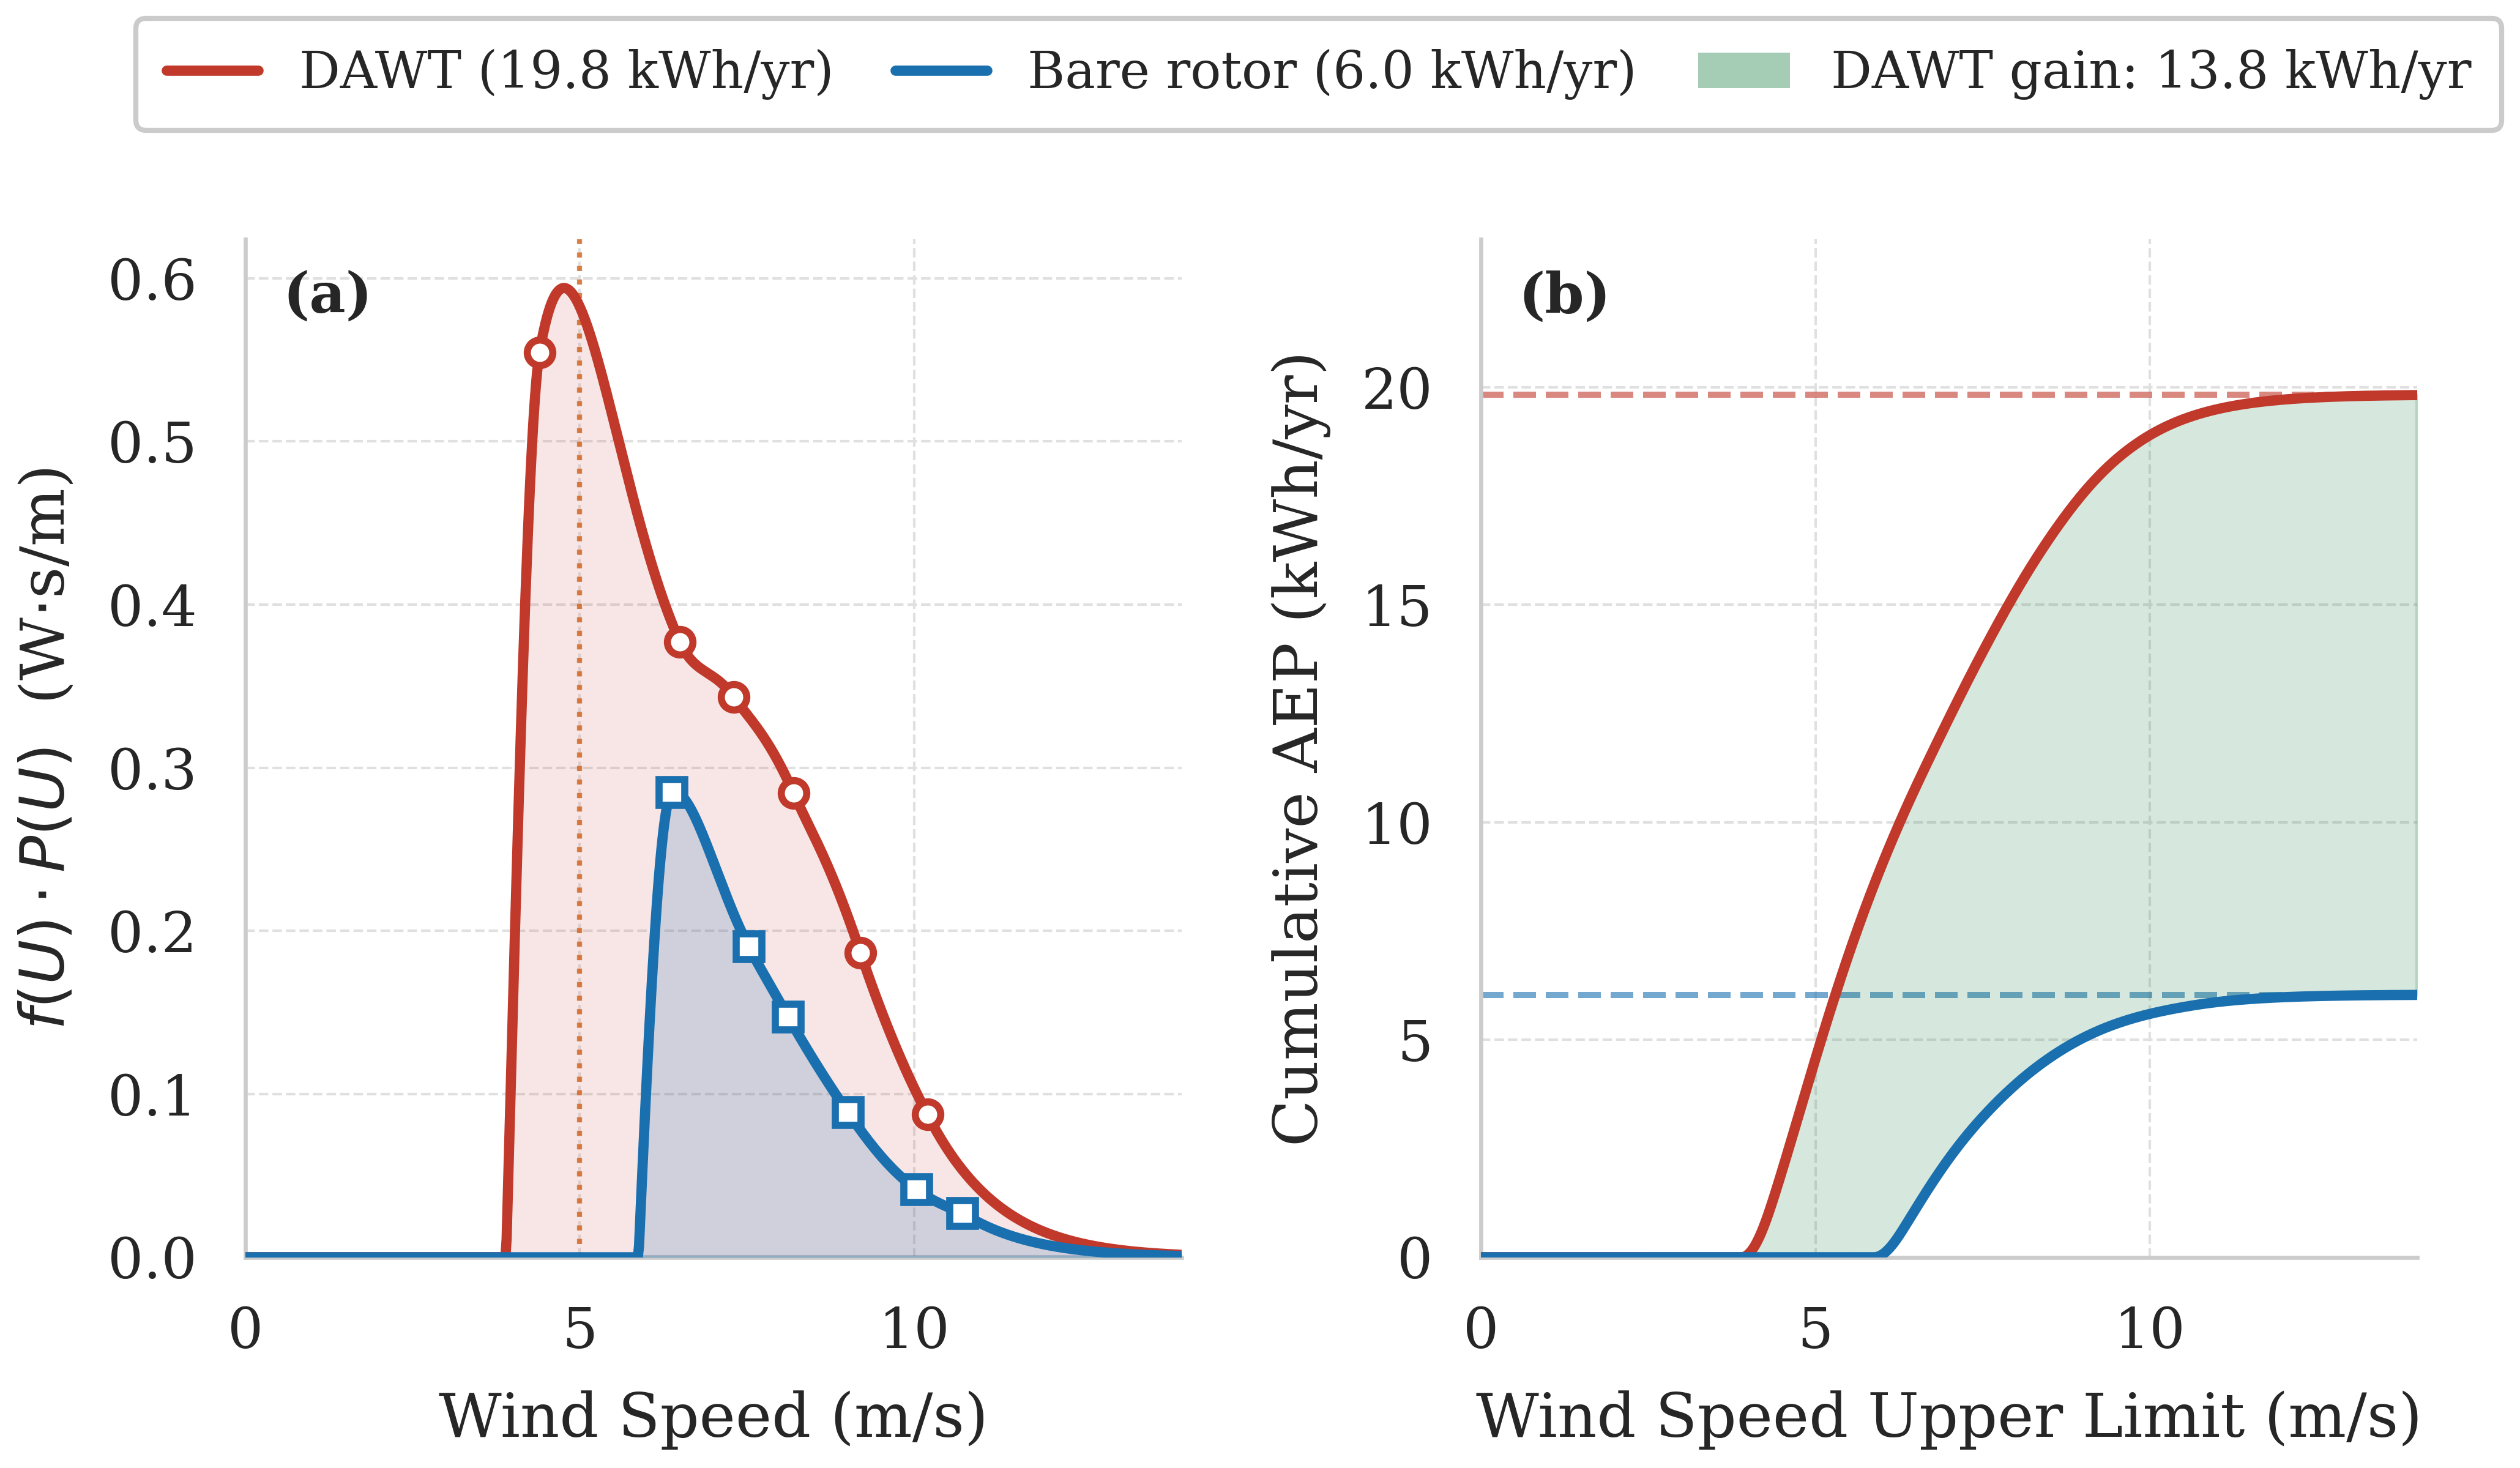
These values are comparative scenarios rather than expected outdoor yields. The calculation combines rooftop wind data with indoor blower measurements and does not include verified rated or cut-out operation, wind direction, site availability, or long-term outdoor performance.
Main results
| Quantity | Bare rotor | Ducted rotor |
|---|---|---|
| Peak rotor-area-normalized power coefficient | 0.43-0.44 | 0.86-0.89 |
| Complete-device power coefficient | - | 0.57-0.60 |
| First measurable rectified DC output | 6.38 m/s | 4.40 m/s |
| Measured DC power range | 5.56-15.56 W | 4.25-30.75 W |
| Principal annual-energy scenario | 6.03 kWh/year | 19.83 kWh/year |
Conclusion
The rotor-free calculations identified Duct 6 as the strongest candidate among the six geometries. Blade-resolved CFD then predicted higher rotor torque, power, and thrust for the integrated ducted turbine. The blower tests showed the same performance ordering, with a lower observed electrical cut-in and greater rectified DC power for the ducted configuration.
The results demonstrate a comparative improvement under the stated numerical and blower-test conditions. They do not establish absolute turbine efficiency, certified cut-in behavior, or long-term outdoor energy yield. Further work should include direct shaft-torque measurement, generator and rectifier efficiency measurements, repeated testing in a calibrated flow field, a grid study for the integrated model, and outdoor testing.